The digital plant over your real plant

From Track to Act.

Give us the keys to your ERP. We'll hand back a cockpit — every point of your plant instrumented, the next move teed up.

Launch the cockpit →Talk to usA name and an email opens it. No password.
Tank 2 · Surfactant62% 4.2 days cover
Blend Line 2 · Throughput84 batches / wk
Input cost · This wk+0.4% watch
Loadout margin · Today$2.14 /case · healthy
Company margin
13.5%● on plan
Every signal · one gauge

Your ERP records everything.
It decides nothing.

Which product lost margin this month?
Answerable — eventually
Which division, and by how much?
Answerable — by hand
What do I change on Monday?
Not answerable at all
From track to act

Every gauge opens.

One thread from the demo, start to finish.

01 · Signal
22.0%
Watch
Water Systems

The richest division in the book — flagged anyway.

02 · Evidence
Margins → Trends → Water Systems

Under its own mean since July. The dip has a date.

03 · Move
Next move

Reprice the five SKUs dragging Water Systems under its mean.

Teed up before month-end absorbs it

You leave with Monday's move.

Why us

Simpler than you'd think.

We don't waste your time — we hand you a product that works.

The product

A product, not a promise.

We build cockpits — instrumented business intelligence that ends in an action. One product, clearly defined. You know exactly what you're getting.

The people

Business People, Who Harness Tech.

We understand your business because it's the business we live in — high-volume, tight-margin.

The switch

An overlay, not an overhaul.

From conception to action is quick — a short conversation gets you a working cockpit to test-drive, and then tell us what to customize. No rip-and-replace, nothing new to learn: it layers on the ERP you already run. No ERP yet? We'll stand up a lightweight one.

The cockpit

Built to be flown,
not read.

Three screens. Every number traces to a transaction.
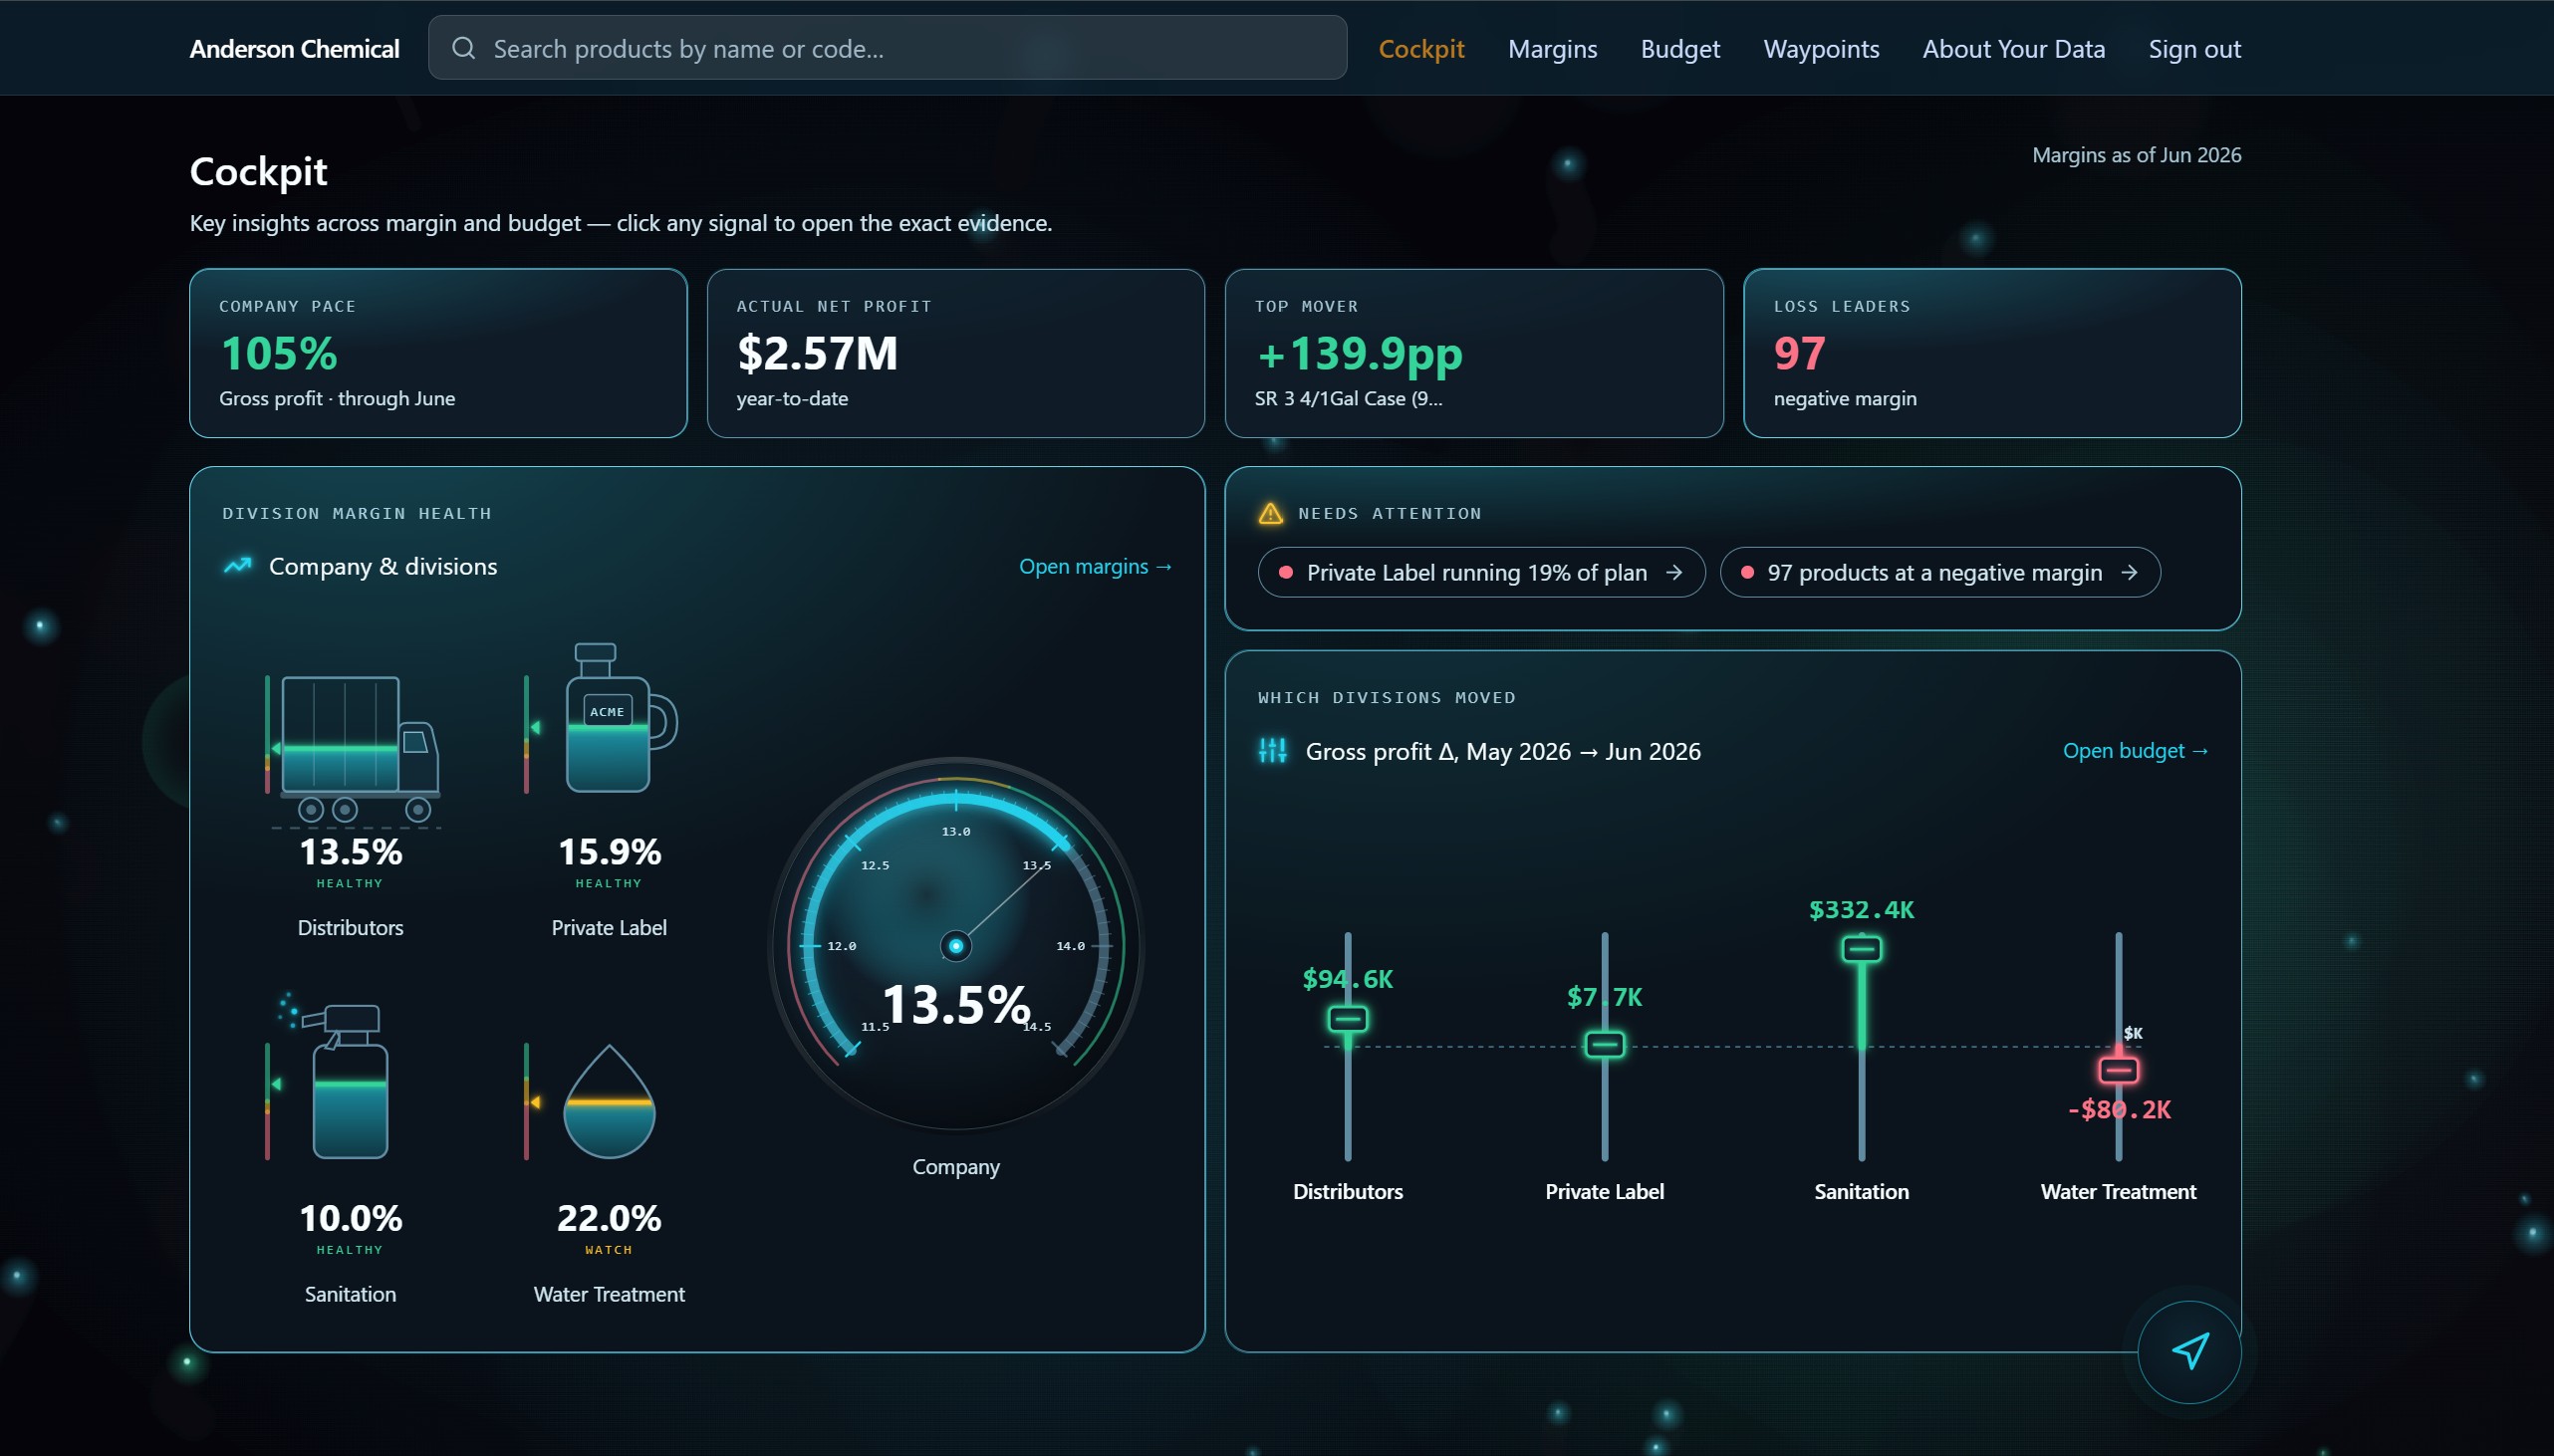
CockpitEvery signal · one screen
The cockpit screen: company pace, net profit, top mover and loss leaders across the top; division margin gauges and a needs-attention panel below.

Pace, profit, movers, leaks — one glance.

01 / 03
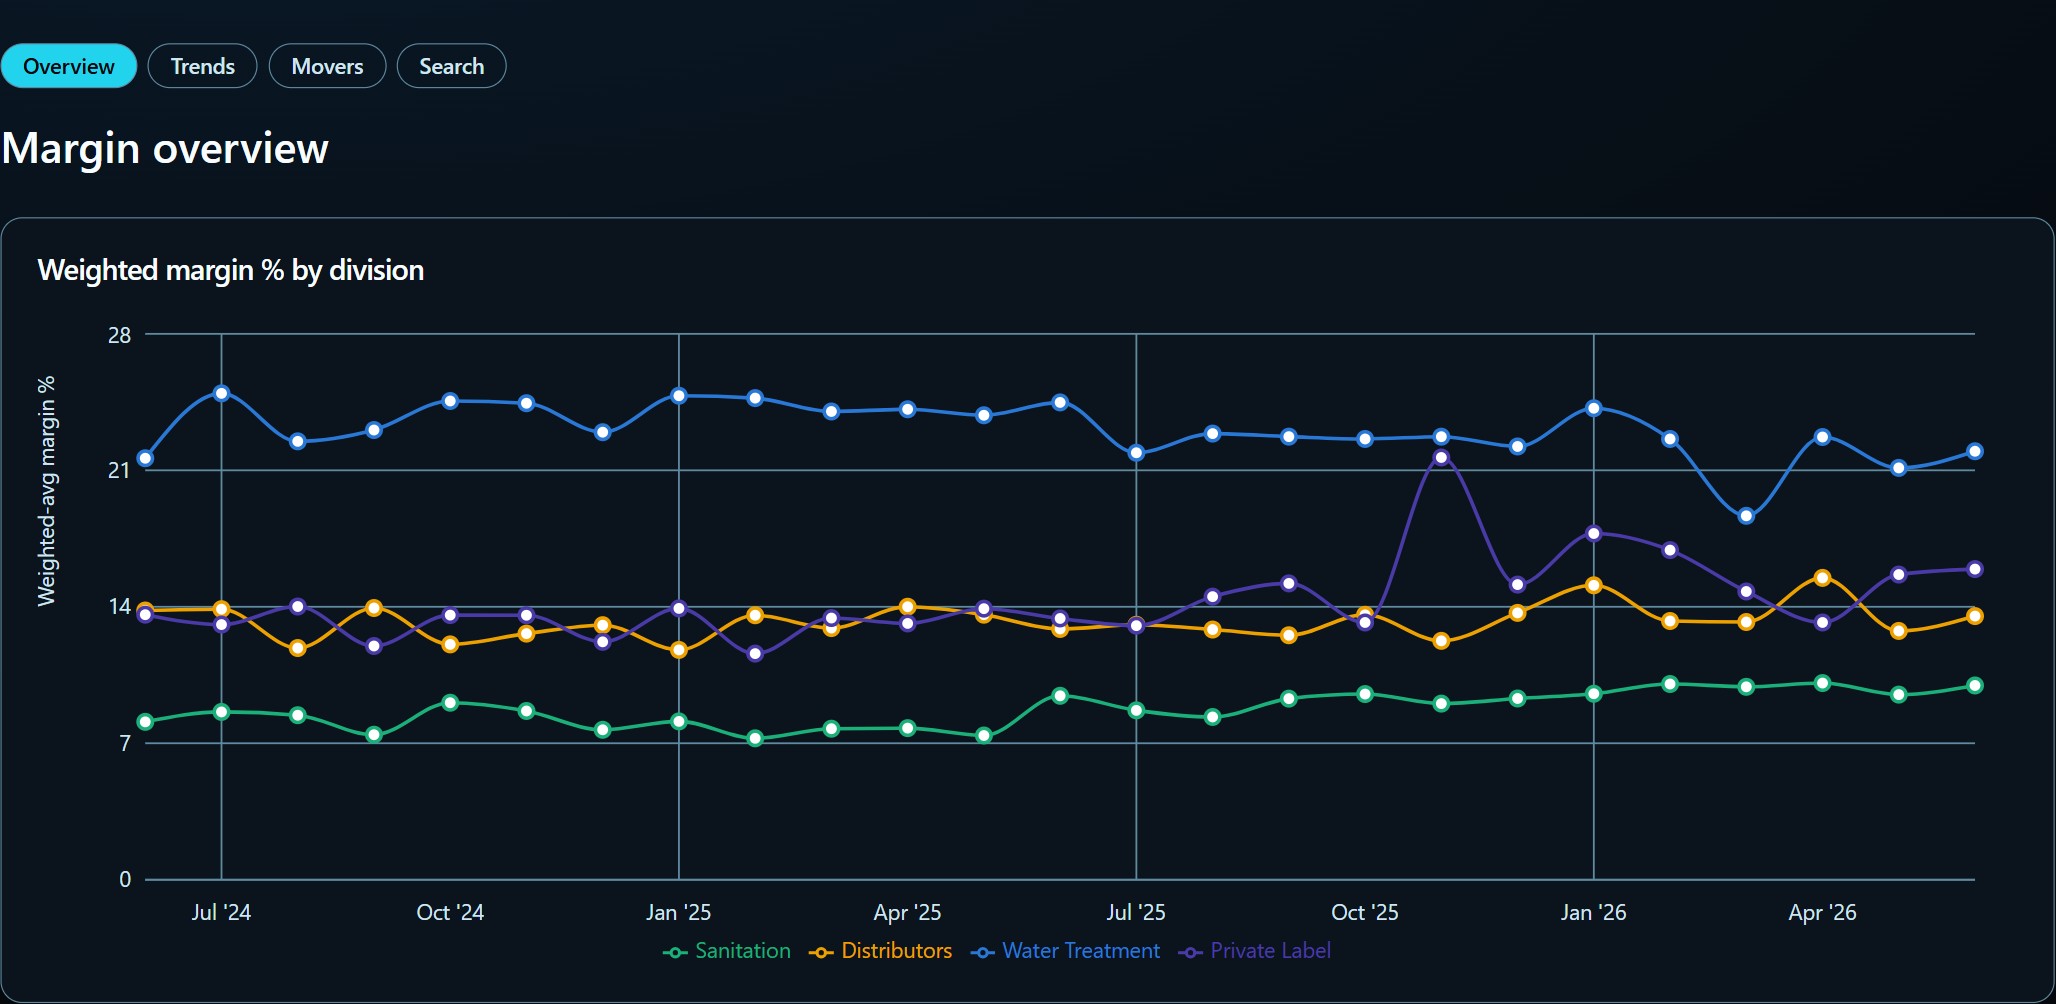
MarginsWeighted margin by division
Margin overview: weighted average margin percentage plotted by division across two years.

Two years of margin, division by division.

02 / 03
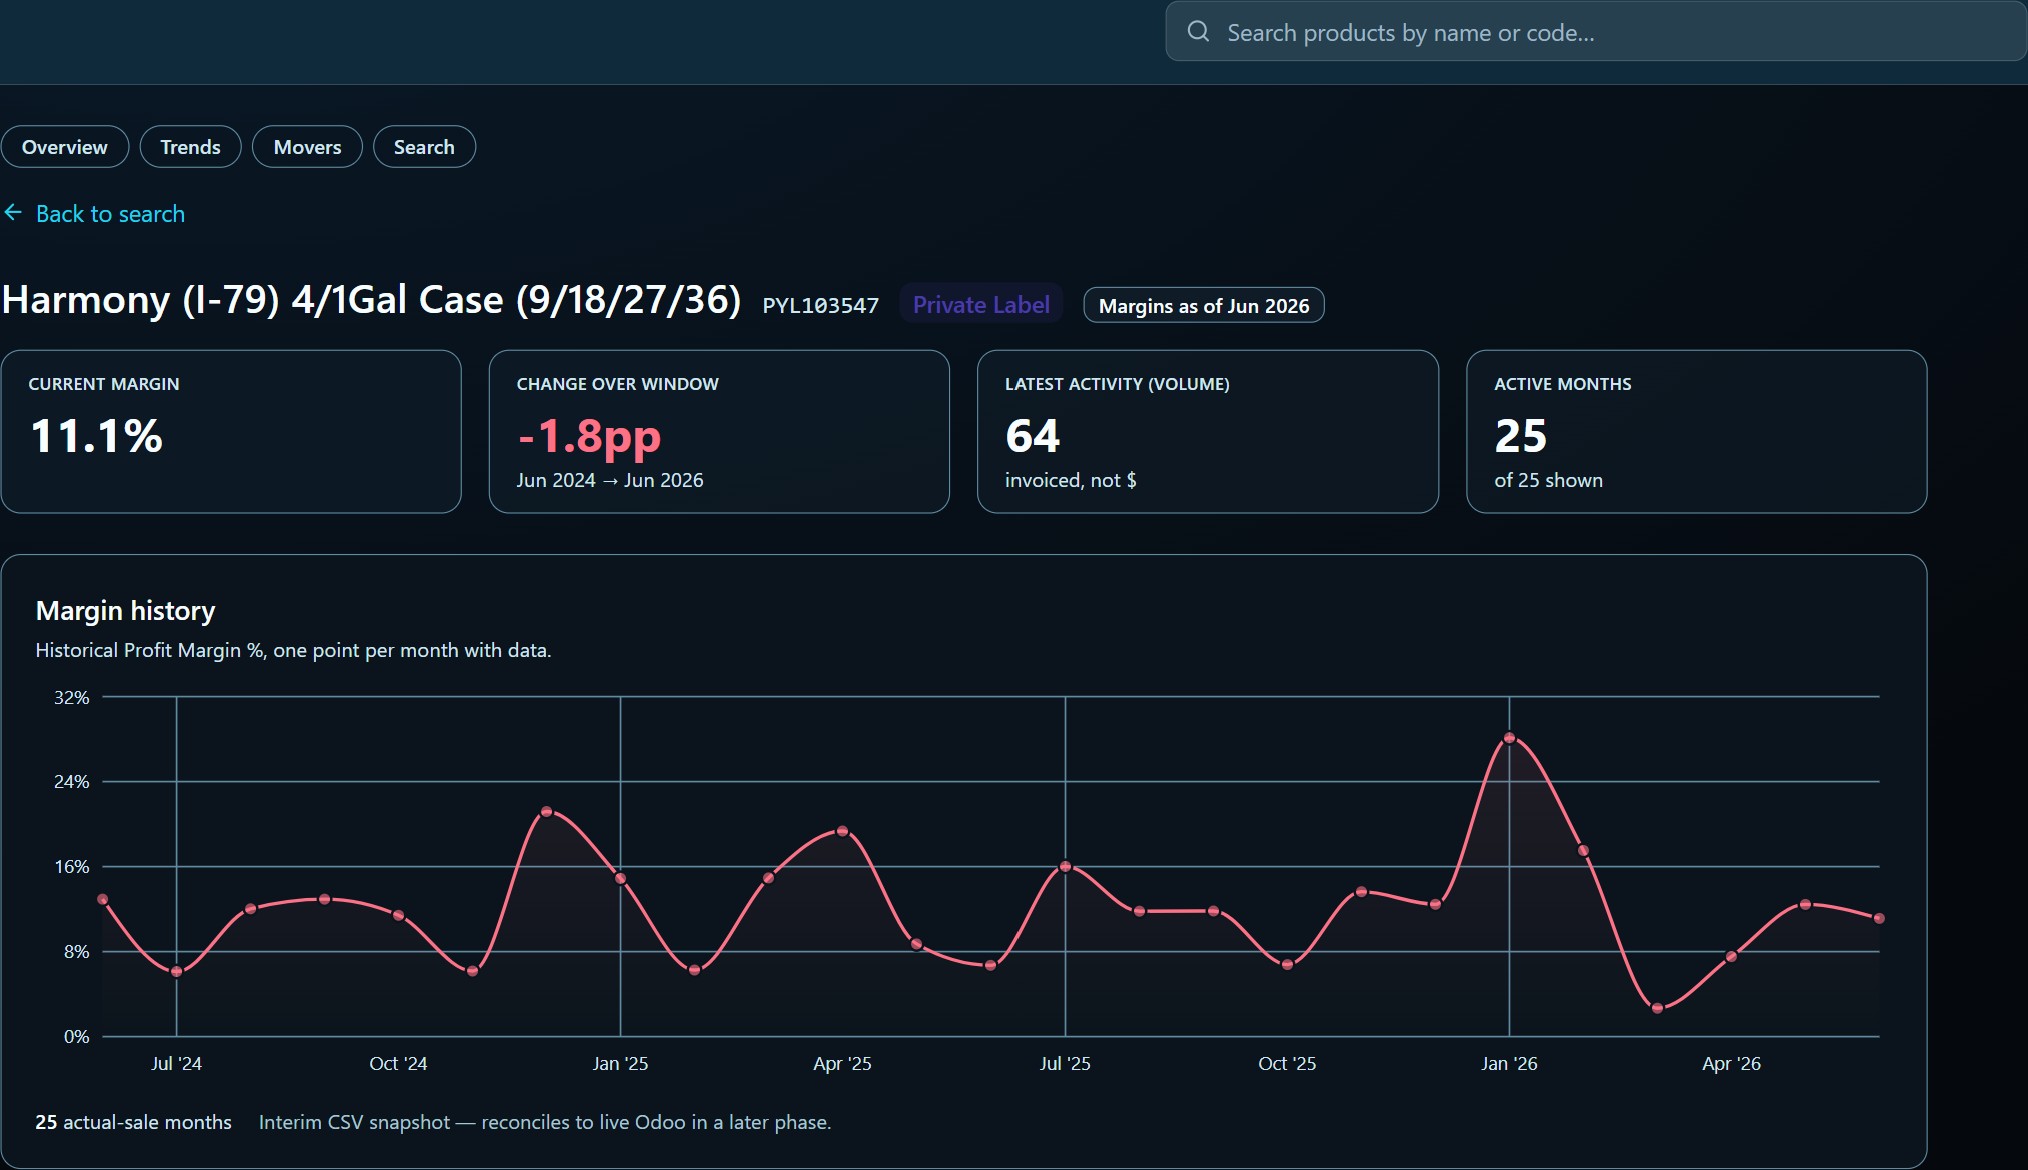
ProductOne SKU, end to end
Product detail: current margin, change over the window, latest activity and active months, above a full margin history chart for a single SKU.

Any SKU, down to the month.

03 / 03

Take the controls.

Eleven hundred products. Four divisions. Live data. Fly it yourself.

Launch the cockpit →
The handoff

Give us the keys.

01 — Connect

Point us at your ERP.

Odoo, NetSuite, Sage — or the export you already run. Read-only to start. We take it from there.

02 — Instrument

Every reading gets a threshold.

Product, division, plant — gauged against your number, not an industry average.

03 — Act

Every signal opens to the move.

Click a reading, see the evidence, know Monday's move.

Read-only accessYour data stays yoursFirst cockpit in weeksNo rip-and-replace
How we work

One cockpit at a time.

Weeks to first light, not quarters.
Your margin math, not a template.
The builder answers the phone.
We stay after go-live.
The founders

Built by the founders of Quantum Hedging

Three decades of market data, quantitative modeling, and portfolio management — turned into the instruments on your glass. No outsourced build team.

They don't hand this off. The people who built the models answer the phone.

The founders
  • Kevin McNew, PhD — Economist & Principal ArchitectMarket Data & Signals
  • Cy Monley — Principal & CTA ManagerAg Markets & Portfolios
  • Satish Nandapurkar — Model Architect & Options StrategiesQuant & Risk
Meet the team →
Contact

Let's look at your margin.

Tell us what you run. We'll show you what belongs on your glass.

Or reach us directly
info@quantum-hedging.com

We reply ourselves, usually within a business day.